The problem, in four numbers
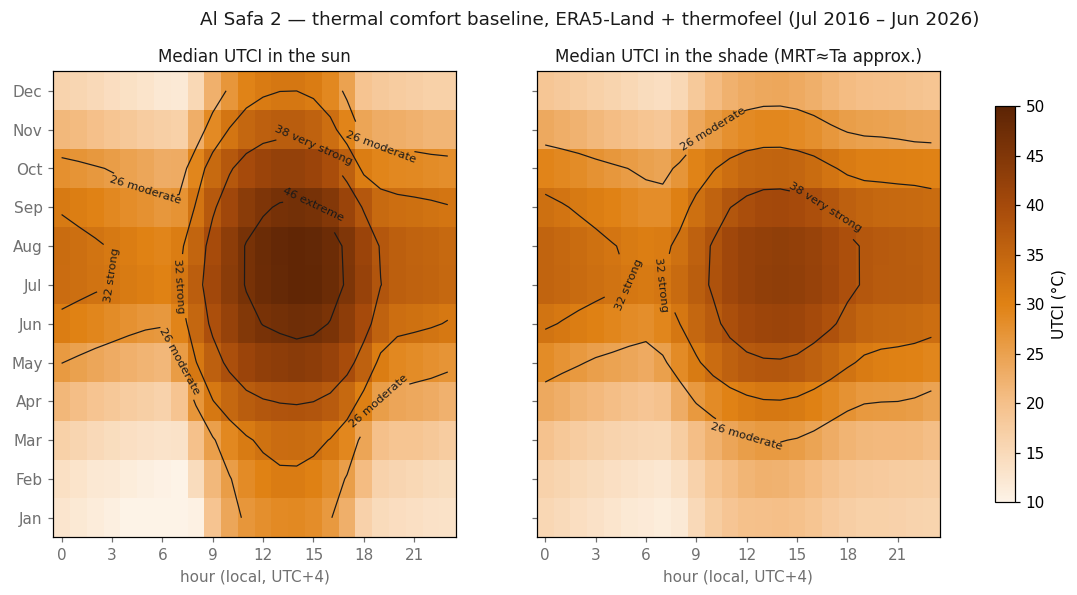
Ten years of hourly thermal-comfort reanalysis at one Dubai neighbourhood park.
Greenery is the wrong metric
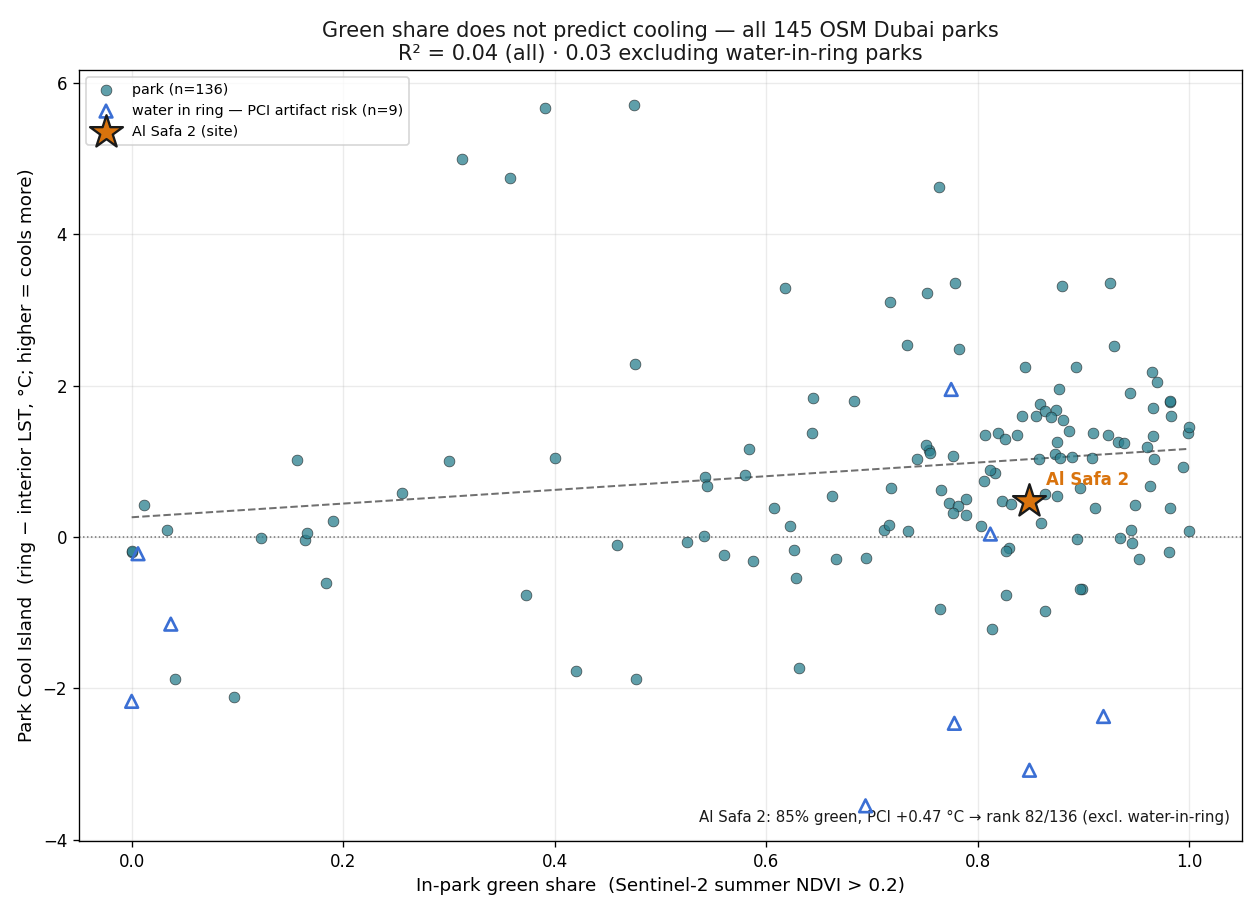
We screened every OSM-mapped park in Dubai — 145 parks, one method, one afternoon, one laptop. Green share explains only ~3% of the variation in how much a park cools its surroundings. The four strongest coolers are all pond parks. What cools is dense canopy shade, water and scale, not lawn under full sun.
Tier 1 — desk analysis: free data, open models, no site visit
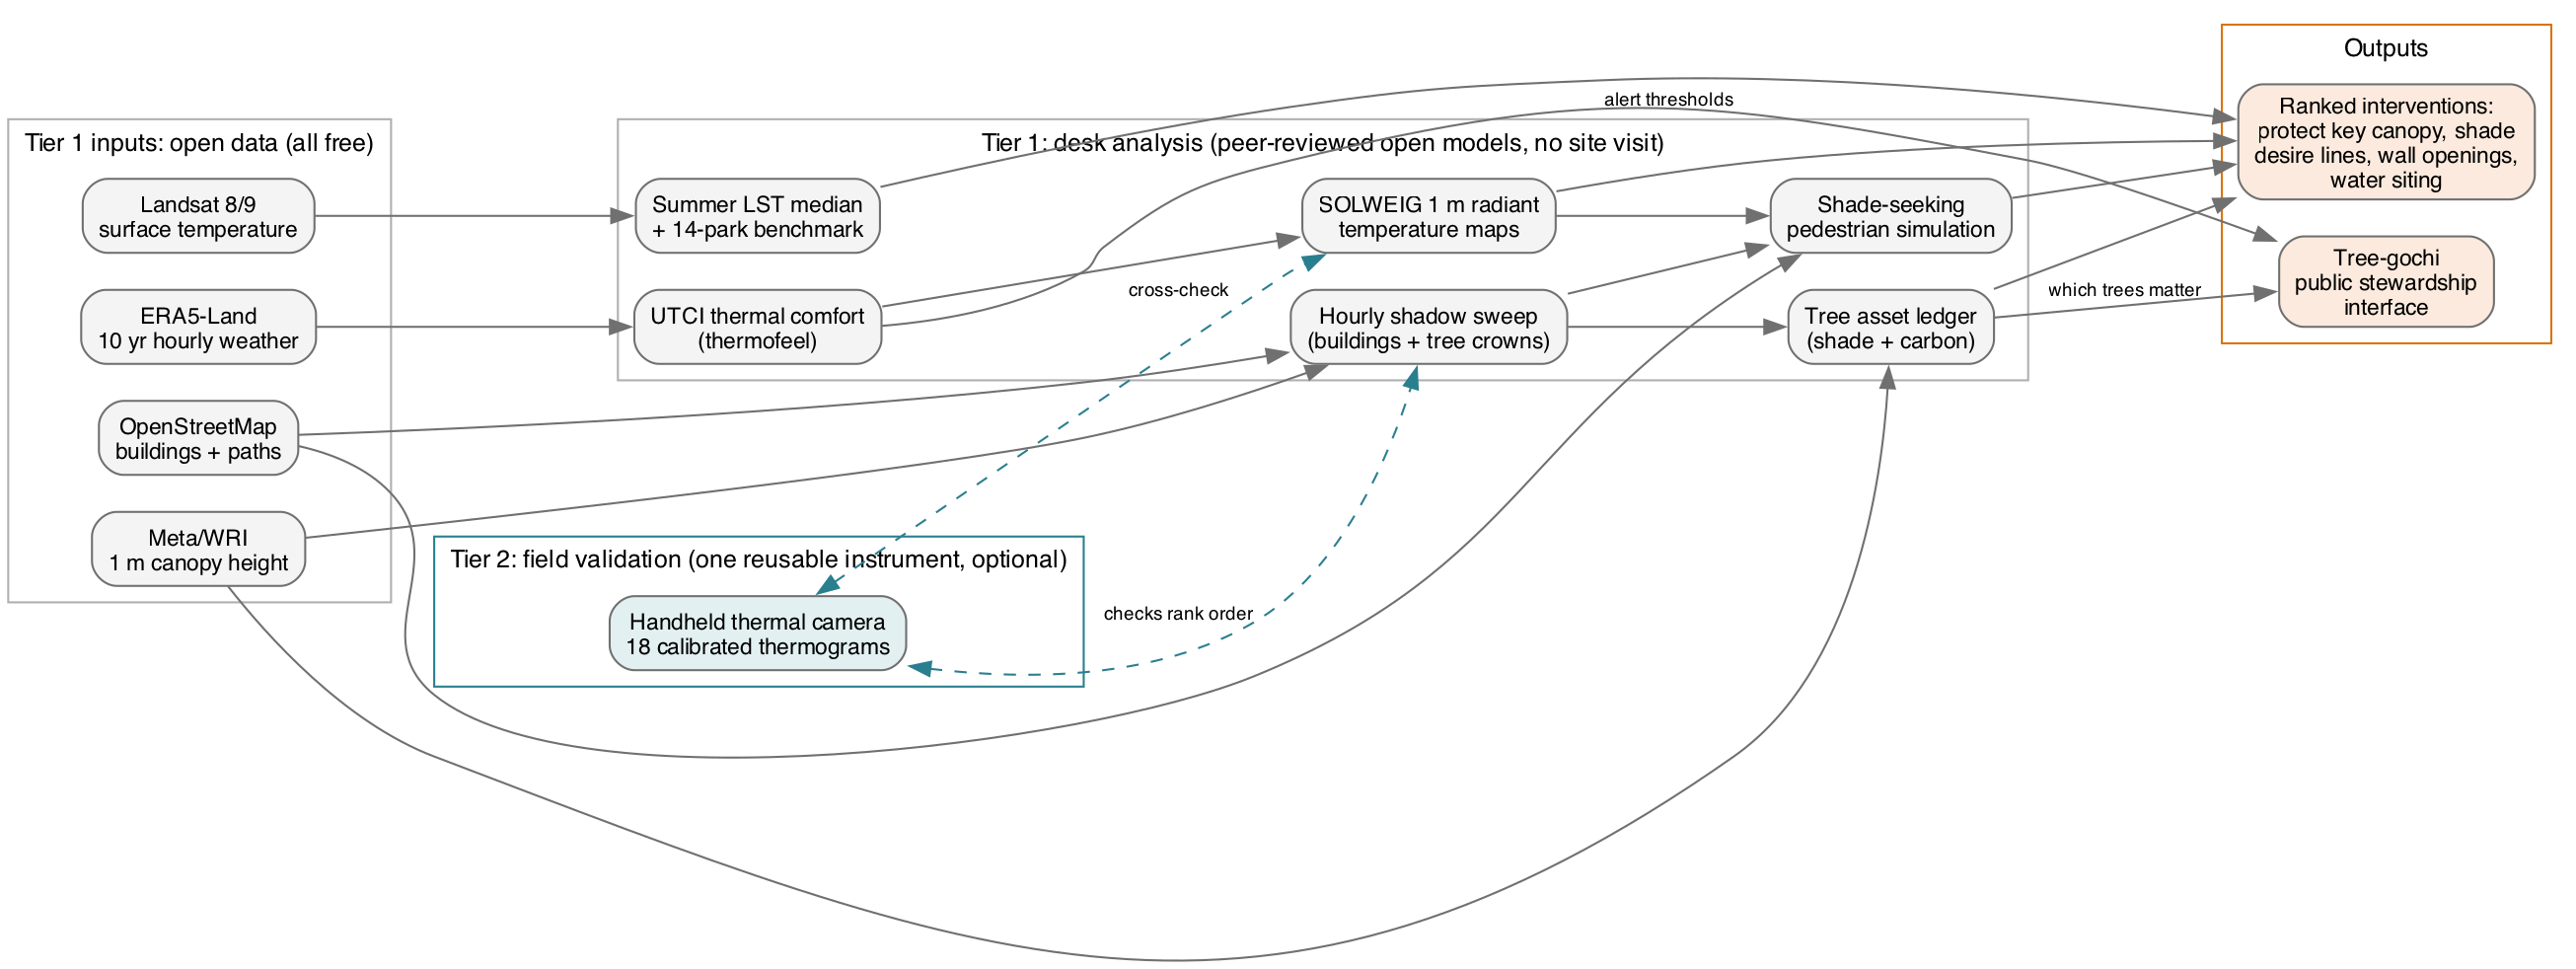
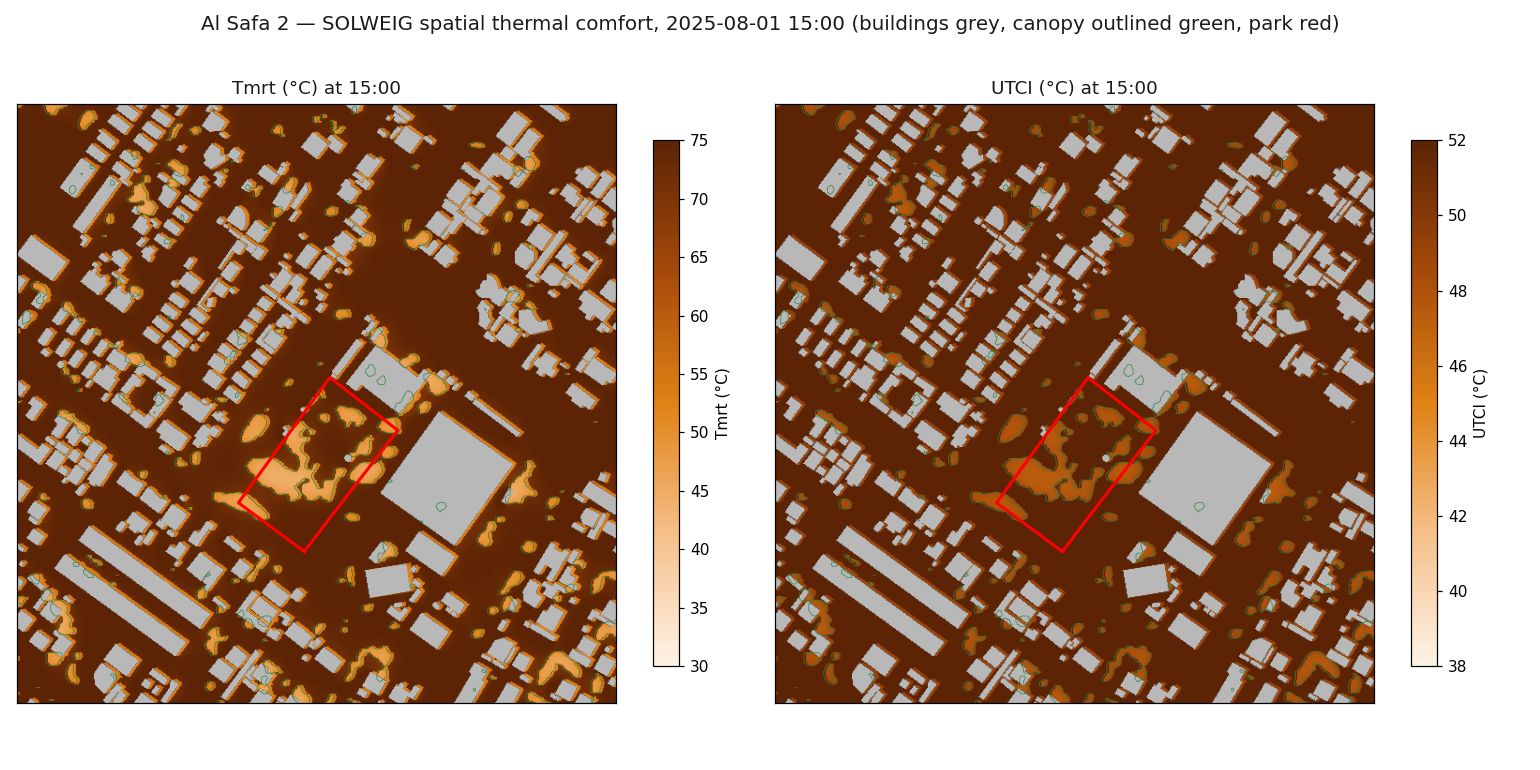
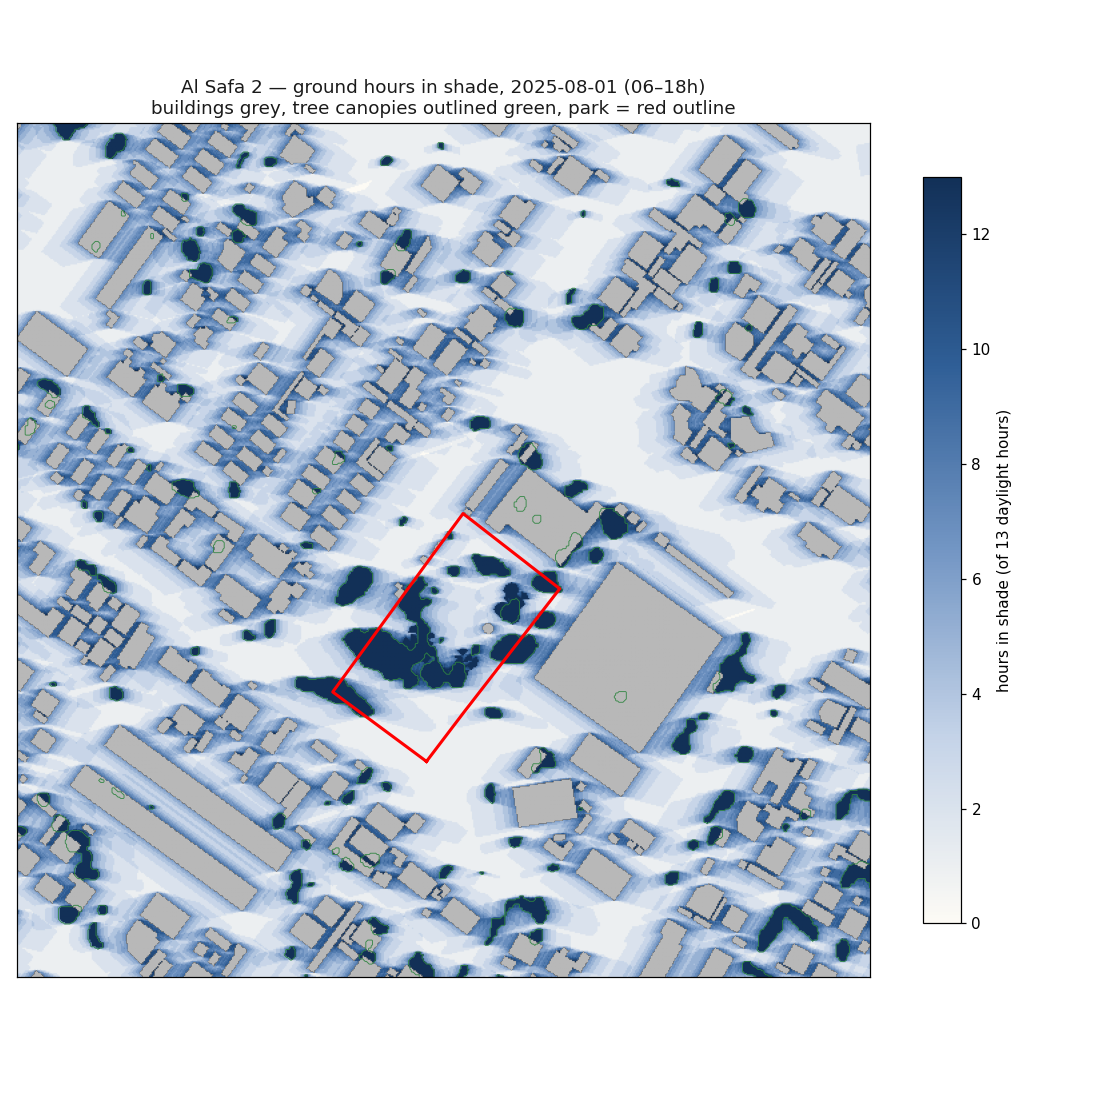
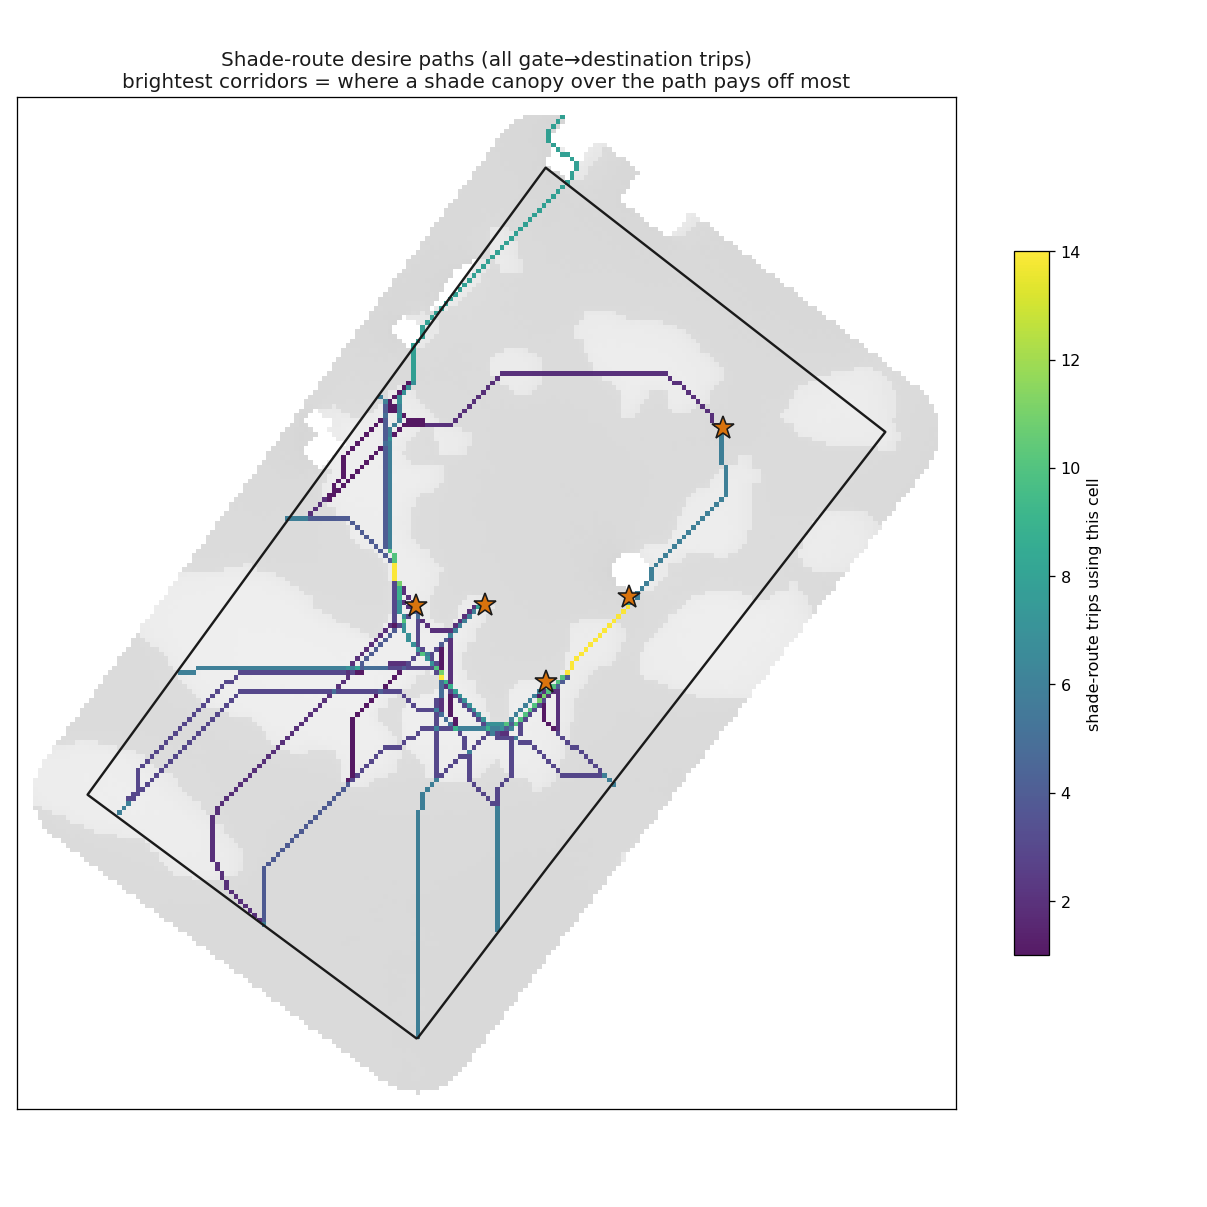
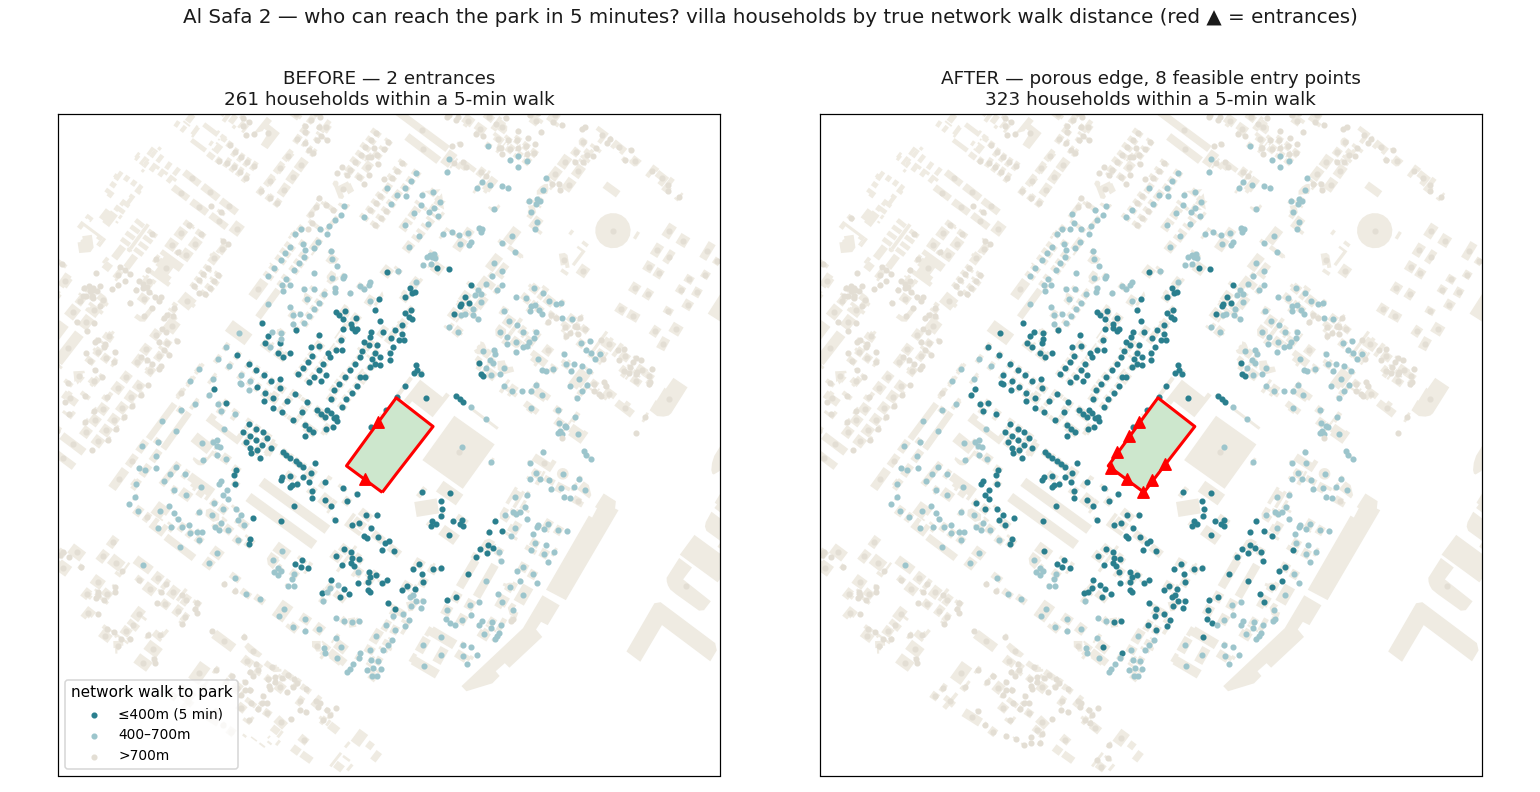
Satellite surface temperature, ten years of hourly UTCI, 1-metre radiant-heat maps, an hourly shadow model of every building and tree crown, a shade-seeking pedestrian simulation and a tree asset ledger, chained into one reproducible pipeline that runs for any park on Earth from a laptop. The city census above is this tier working as a triage instrument: screen every park, then send the deep analysis and the retrofit budget where they matter.
Tier 2 — field validation: one camera, one evening
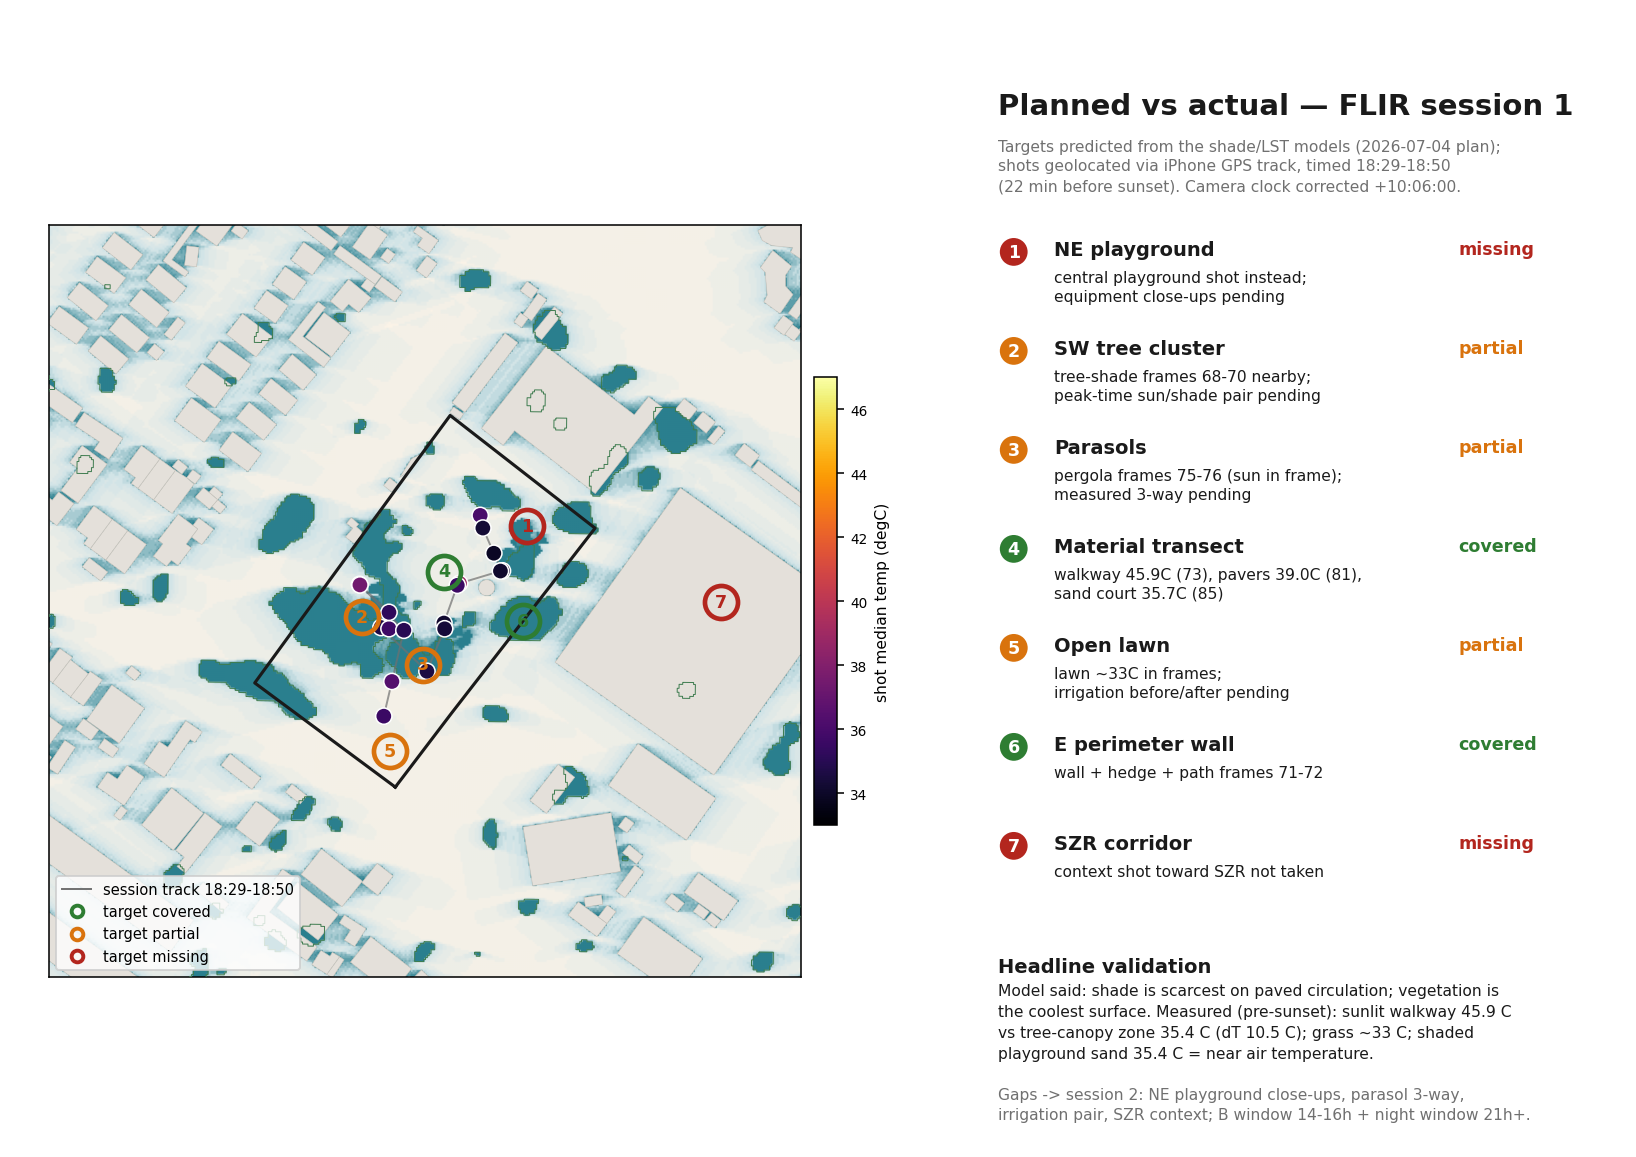
Models that never meet a measurement are easy to believe and easy to get wrong. A handheld thermal camera (≈US$550) closed the loop: 18 calibrated thermograms across the park, georeferenced and compared against the model. The least-shaded modelled locations are the hottest measured ones. One camera serves every park a city owns.
Tree-gochi — the trees ask for help
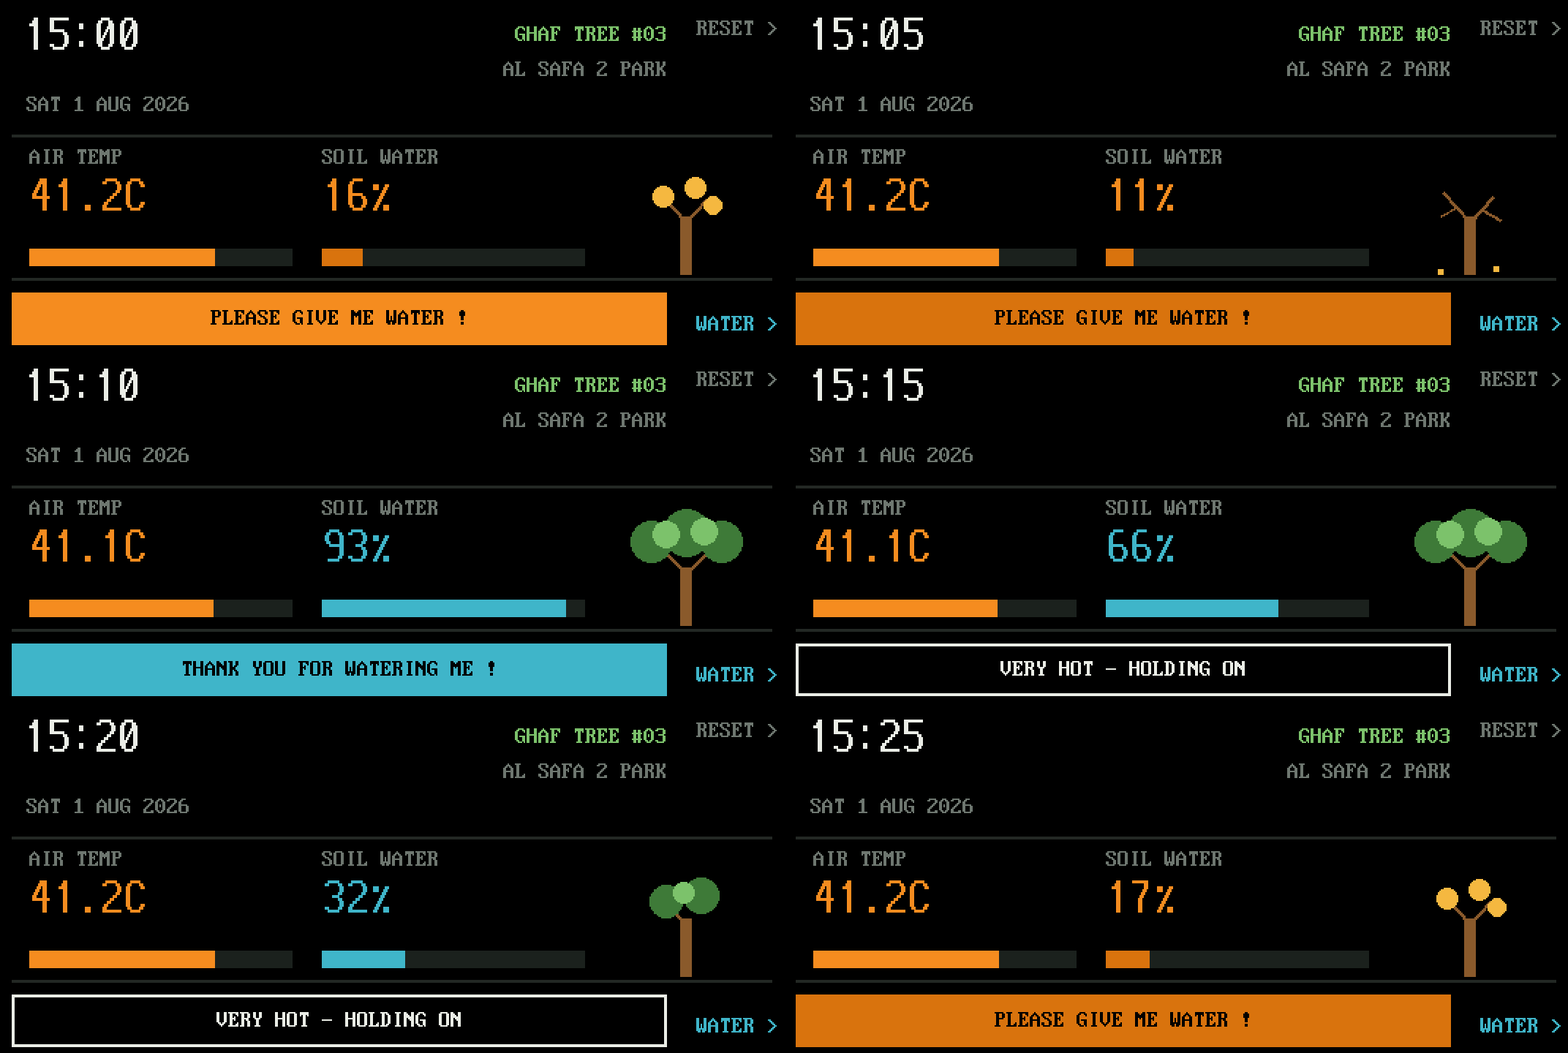
A modern take on Botanicalls (2006), the plant-that-phones-you kit from the early Internet-of-Things era, exhibited at MoMA and held in its permanent collection. The analysis found that one tree cluster provides 59% of the park's shade. Tree-gochi exists to keep those trees alive: a US$25 open-hardware device whose pixel Ghaf tree visibly wilts as soil moisture drains and asks, in words, to be watered. Alert thresholds come from the project's own UTCI analysis. No auto-refill: the tree's fate is the community's responsibility.
Explore the model yourself
The interactive 3D explorer below is a direct output of the toolkit: 1,336 buildings and 214 tree-canopy patches, with an hourly sun slider and toggles for hours-in-shade and UTCI overlays, all precomputed by the same pipeline.